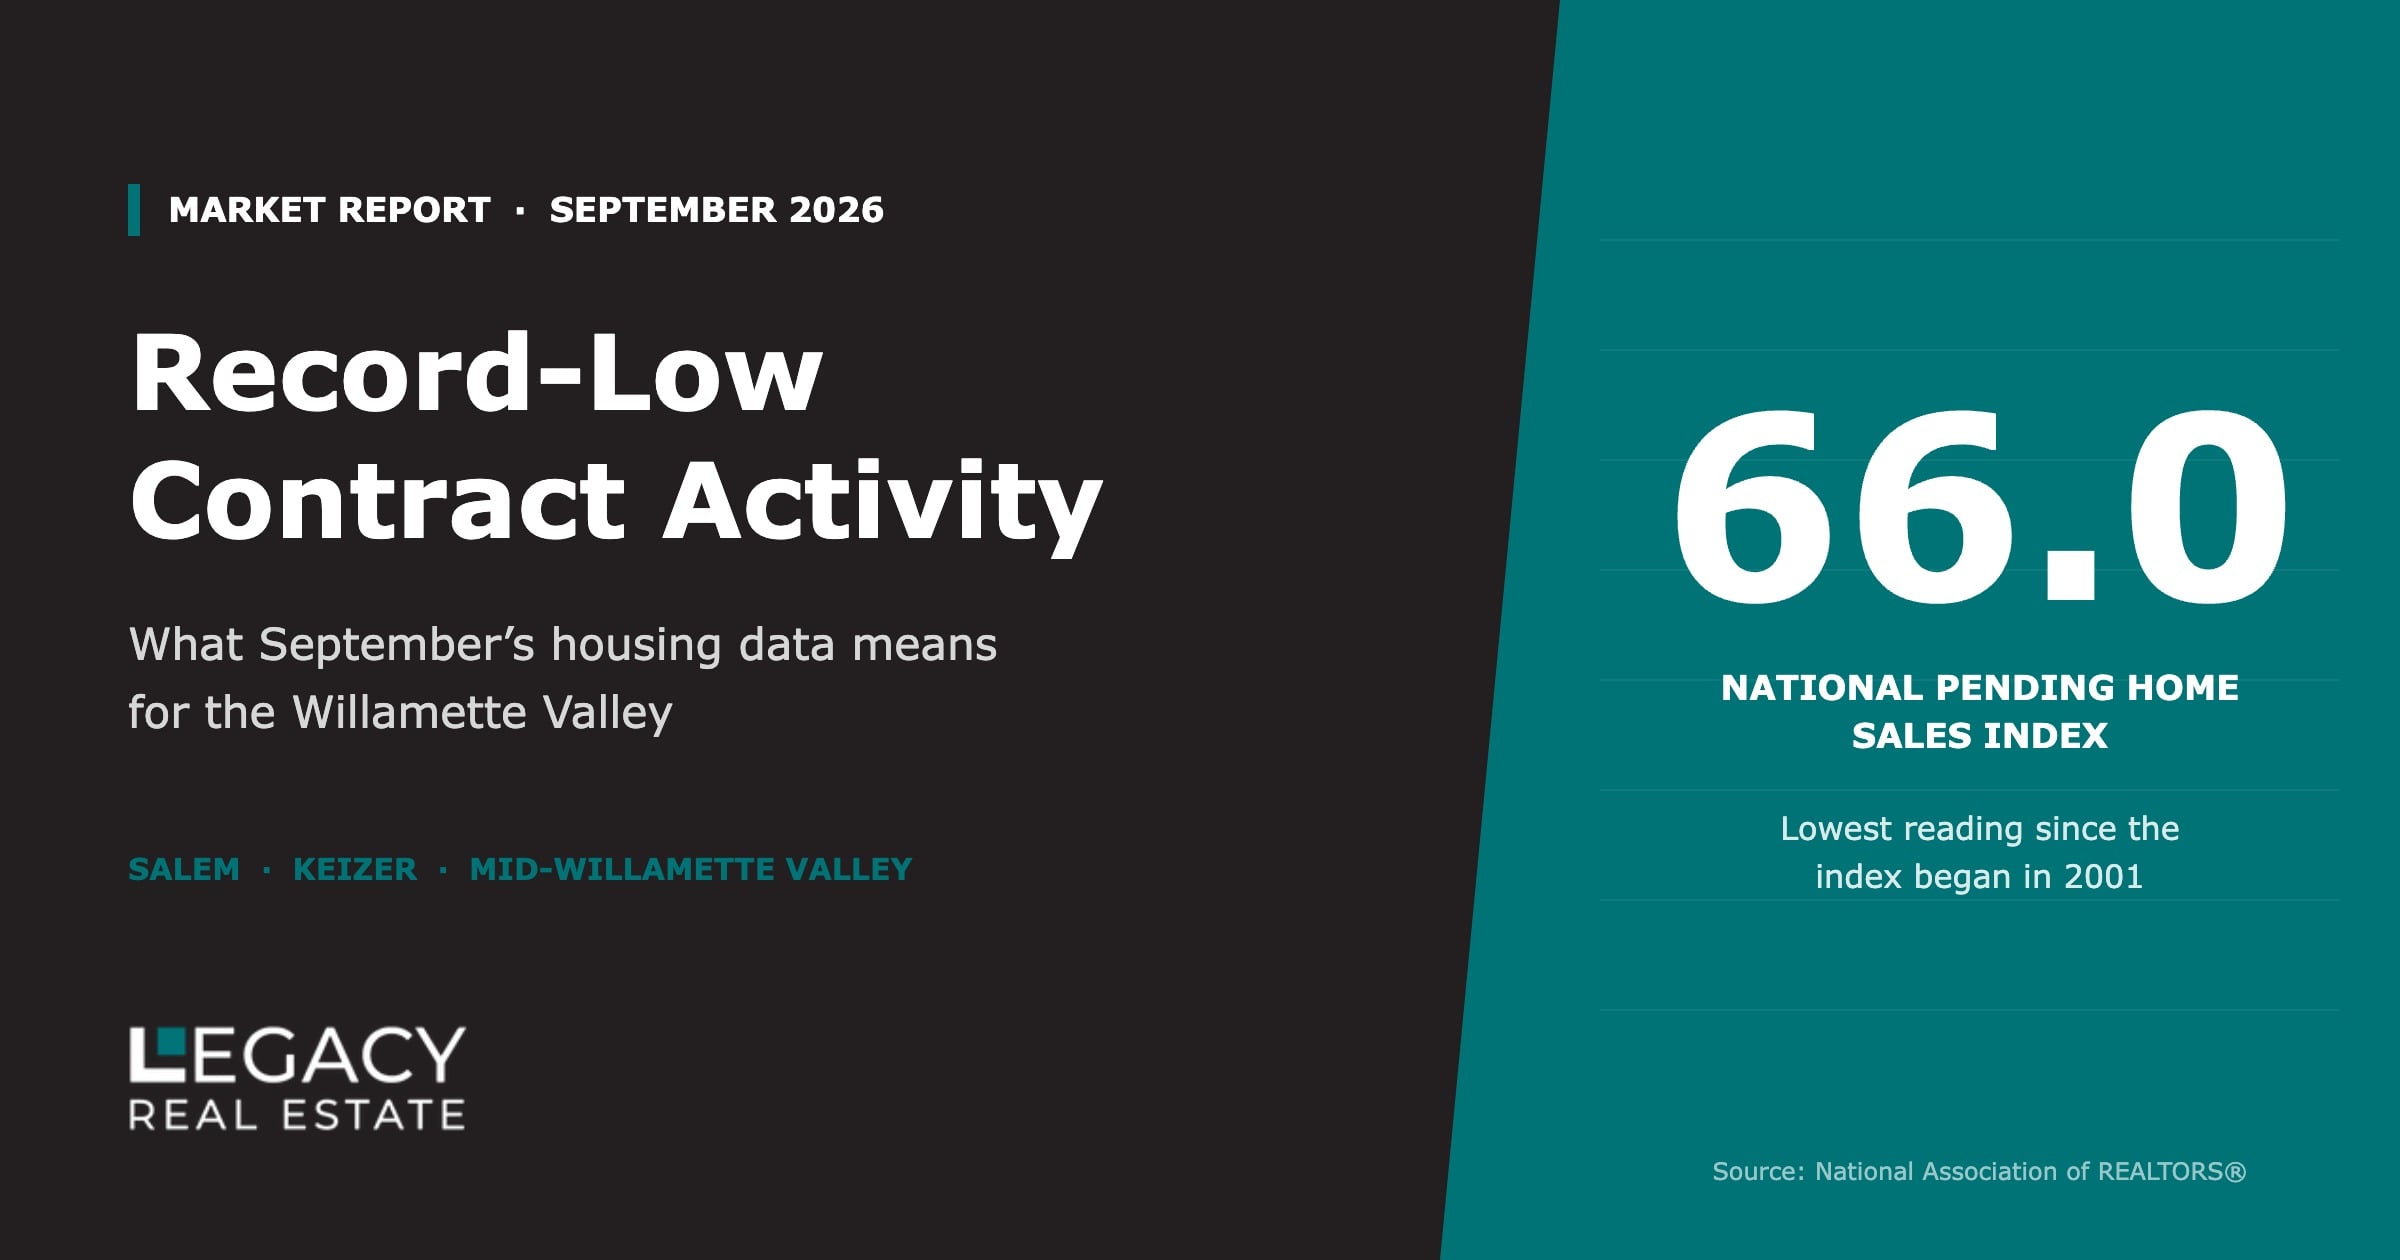
Pending home sales in the United States fell to the lowest level ever recorded in September 2026. The West took the hardest hit of any region. Headlines like that get attention, but they don't tell you what's happening on your street.
Here is what the data actually shows, and what it means if you plan to buy or sell in Salem, Keizer or the mid-Willamette Valley.
The headline numbers
According to the National Association of REALTORS® (NAR), September 2026 brought:
- A national Pending Home Sales Index of 66.0. That is the lowest reading since the index began in 2001.
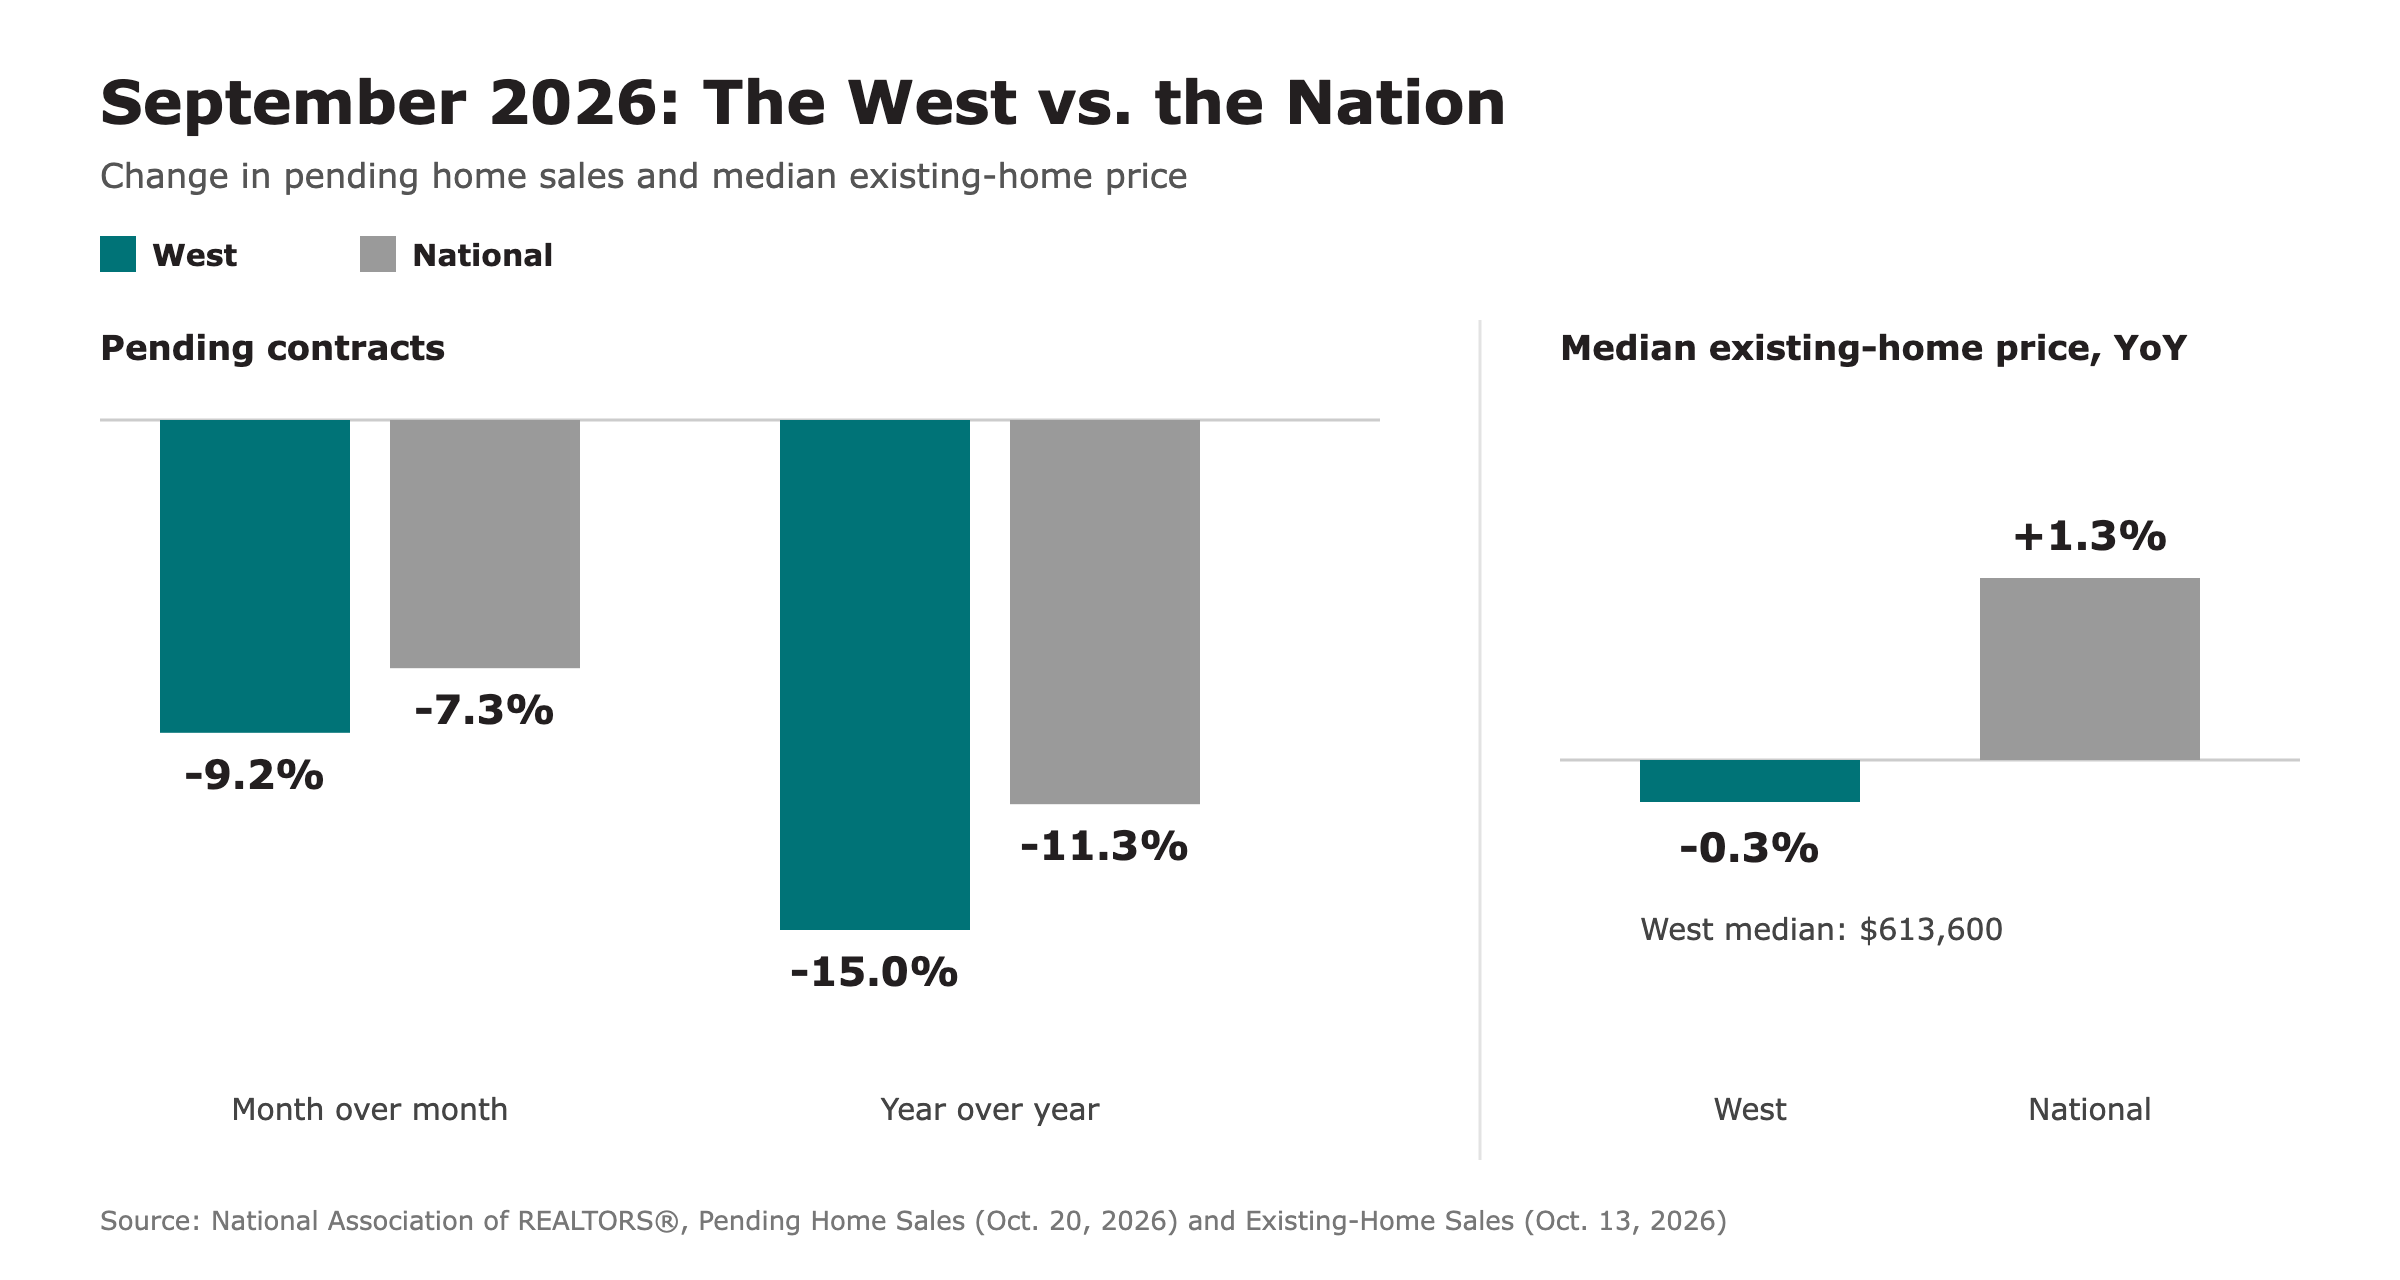
- A 9.2% monthly drop in Western pending contracts, compared with 7.3% nationally.
- A 15.0% annual drop in Western pending contracts, compared with 11.3% nationally.
- A Western median existing-home price of $613,600, down 0.3% year over year. The national median rose 1.3% over the same period.
Put simply, buyers are signing fewer contracts and are becoming more price-sensitive. That is a meaningful shift. It is not a collapse in home values.
What a "record low" actually means
The Pending Home Sales Index measures signed contracts on existing homes, condos and co-ops. Contract activity in 2001 is set at 100. A reading of 66.0 means activity is 34% below that baseline.
It does not mean prices fell 34%, and it does not mean activity dropped 34% in one month. It's also a national reading. No one has independently established an Oregon record low.
The index matters because it typically leads closed sales by one to two months. It's an early look at where the market is heading.
What the Oregon data shows
Local data points in the same direction, with important caveats:
- Statewide: Realtor.com pending-listing counts for Oregon fell 6.39% month over month in September. This measure isn't seasonally adjusted, so it can't be compared directly with NAR's index.
- Portland metro: RMLS-based figures show 1,760 pending sales (down 17.9% year over year), 4.2 months of inventory and a $545,000 median sale price, unchanged from last year.
Portland is not Salem. Regional and metro figures should never be applied to the Salem–Keizer market without local verification.
Why slower sales can lead to lower prices, eventually
Price changes usually trail volume changes. The pattern tends to unfold in three stages:
- Volume slows. Sellers hold firm on price while buyers wait.
- Supply builds. Unsold listings accumulate and homes stay on the market longer.
- Prices adjust. Price reductions and seller concessions increase, and accepted contract prices can fall.
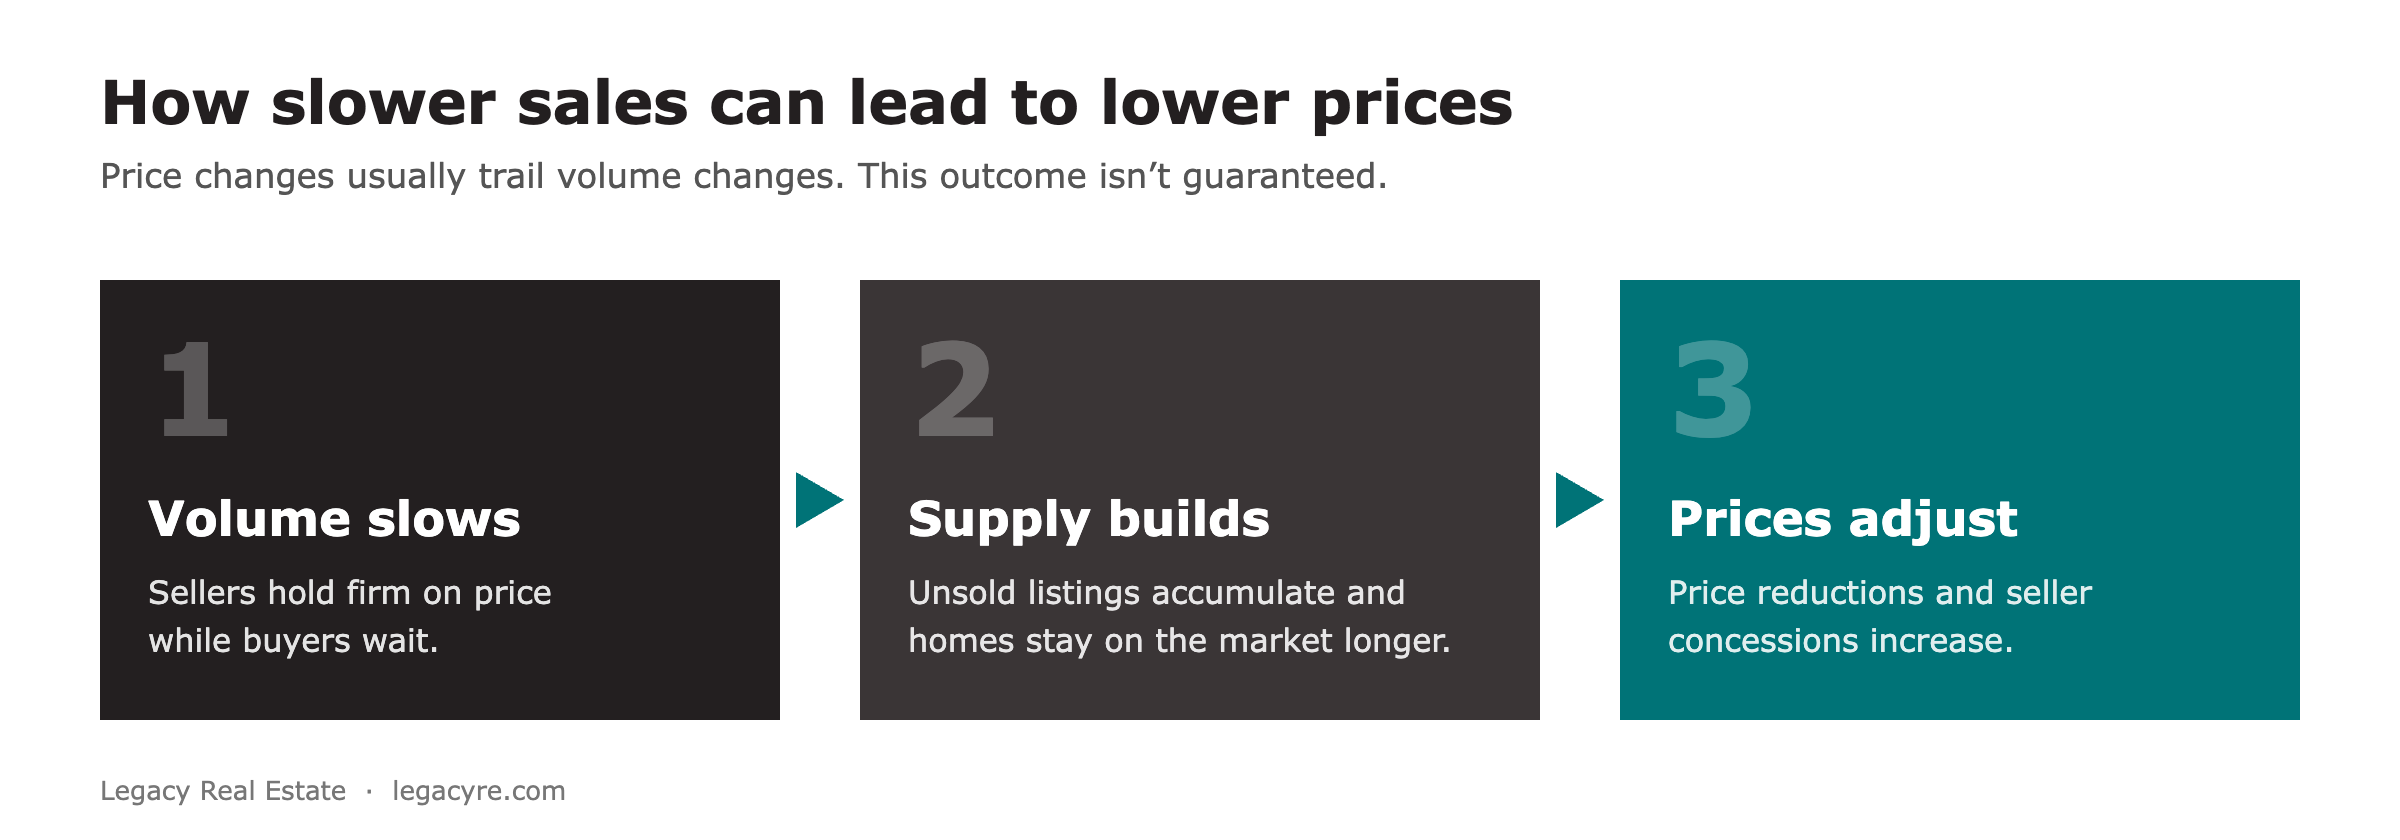
That outcome isn't guaranteed. Fewer new listings, strong homeowner equity, limited distressed inventory and any improvement in mortgage affordability can all support prices.
Nationally, supply is already rising: 1.60 million homes were for sale in September, or 4.8 months of supply, up from 4.5 months a year earlier.
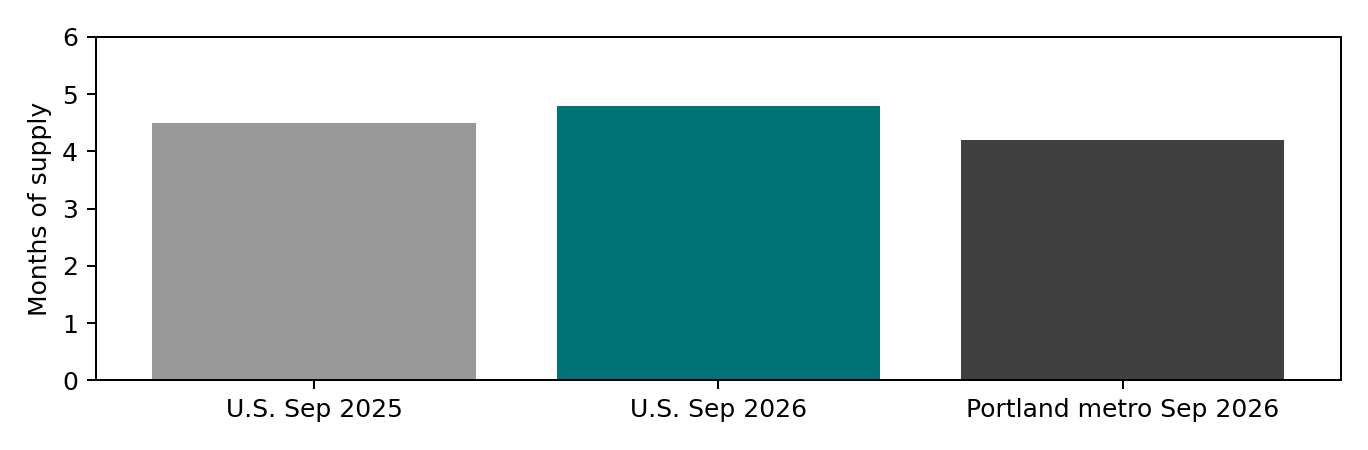
Months of supply: U.S. September 2025 vs. September 2026, and Portland metro September 2026. Sources: NAR; RMLS-based Portland summary.
The signal to watch: several consecutive months of falling pending sales, combined with rising local inventory and weakening sale-to-list-price ratios. One month of data doesn't make a trend.
What this means for you
If you're selling: Price to today's market, not last spring's. Base your list price on current, concession-adjusted local comparables. Plan for a longer marketing period and settle your concession strategy before you list. When buyers have more choices, presentation and launch timing matter more.
If you're buying: Leverage is returning in some segments. Homes with more time on the market and recent price reductions may leave room to negotiate on price, terms or credits. Confirm the local numbers before you assume regional discounts apply to the home you want.
The Legacy approach
National headlines describe the nation, but your decision depends on your neighborhood. At Legacy Real Estate, every pricing and negotiation recommendation is built on submarket-level WVMLS data. We track pending and closed sales, new listings, months of supply, days on market, price reductions and concessions, because that's where the real market shows up first.
James Hauge, Principal Broker, was the #1 non-team broker on WVMLS in 2024 and has closed more than 1,100 transactions totaling over $350 million across residential, commercial and land.
Want to know what this market means for your property? Request a property-specific market analysis. Call 503.877.2101 or email [email protected].
Download the full West & Oregon Housing Report (PDF)
Sources: National Association of REALTORS®, Pending Home Sales (Oct. 20, 2026) and Existing-Home Sales (Oct. 13, 2026); Federal Reserve ALFRED / Realtor.com Oregon pending listing count; Portland metro September 2026 summary citing RMLS Market Action. This article summarizes published third-party data for general information. It is not an appraisal or a forecast of any specific property's value.
Check out this article next